EDP4130 Digital Technologies Resource
Why is data important?
In your books, answer these questions:
Why do you think the team's first prediction was incorrect?
State 3-5 things that are important to consider when collecting data.
What did the team do differently in the second survey?
Next, go to this link to play a game.
http://www.topmarks.co.uk/Flash.aspx?b=maths/interpretingdata
You were required to create two graphs in the game above. Do you remember the names of these graphs?
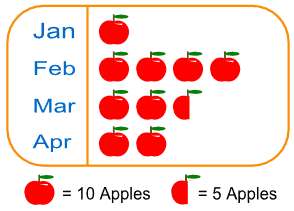
One of the graphs is called a pictograph. You might remember using these last year when you were in year one.
A pictograph is a way of showing data using images. It will have a key down the botton showing the number that one picture represents. Below is an example of a pictogram:
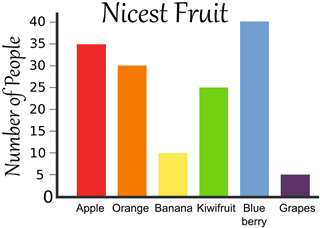
The second graph you were asked to do is known as a bar graph. A bar graph (also called a bar chart) is a graph using bars of different heights. It takes information from a tally or table of data and turns it into a graph.
We can use bar graphs to show the relative sizes of many things. For example, the bar graph below lets us compare the number of people who like different types of fruit. Just by looking at the graph, we can see that most people like blue berries.
We collect data to answer questions when the answer is not immediately obvious, such as, how many hours of TV our grade 2 class watches a night.
Think about what you might want to know about the class, that you wouldn't be able to find out about without a survey.
Share these ideas with your teacher as you will do a class survey.

